Zoe Clarke is a PhD candidate at the University of Toronto studying Computational Biology Molecular Genetics in the Bader Lab.
We are generating a ton of data. In fact, we are generating so much data, that it’s becoming a huge challenge to figure out how to deal with it all. Whether it’s creating cellular maps of the human body, or developing models that we design in a way to reflect some of life’s most complex processes, the way we conceptualize data will constantly cater to the limitations of our brains unless we can find innovative ways to find and view patterns.
As a PhD student in computational biology — basically a fancy designation for the field of using computers to analyze biological data — I will bluntly admit that it is difficult not only to figure out how to best manipulate computers to deal with these data, but also how to make sense of the results that these machines spit out.
To tackle this issue, we have seen the rise in data visualization software to help find patterns in vast data sets that can contain many dimensions. Visualization is key to understanding data — not only for the public or other “non-experts” of the field, but also by researchers who study related topics; often, this is vital even to the people who conduct their own research.
As smart as we may be, humans are not very good at thinking in numbers, especially when data are counterintuitive. Our brains often try to find patterns where patterns don’t actually exist, and our estimation skills are terrible. Therefore, we need to rely on the combination of analysis and visualization to find real patterns within our data and spit them out in a comprehensible way in front of us. Actual human interpretation begins here.
For this to all make sense, I should probably give you a couple of examples.
The development of new data visualization tools leads to breakthroughs in biological understanding. For example, Gary Bader, professor of molecular genetics and computer science at the University of Toronto, has been heavily involved in improving ways to visualize how proteins interact with each other within a cell, which is crucial to understanding how cells function. The proteins act similarly to parts of machines that often work together to create the fully functional cell. These interactions can be incredibly complex, often working either in parallel, or as a cascade, or in other dynamics we have yet to hypothesize.
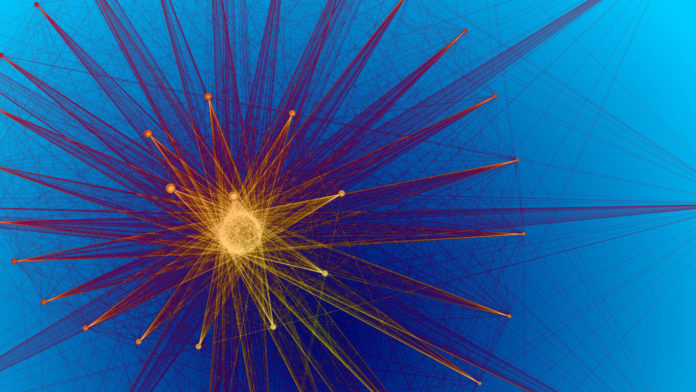
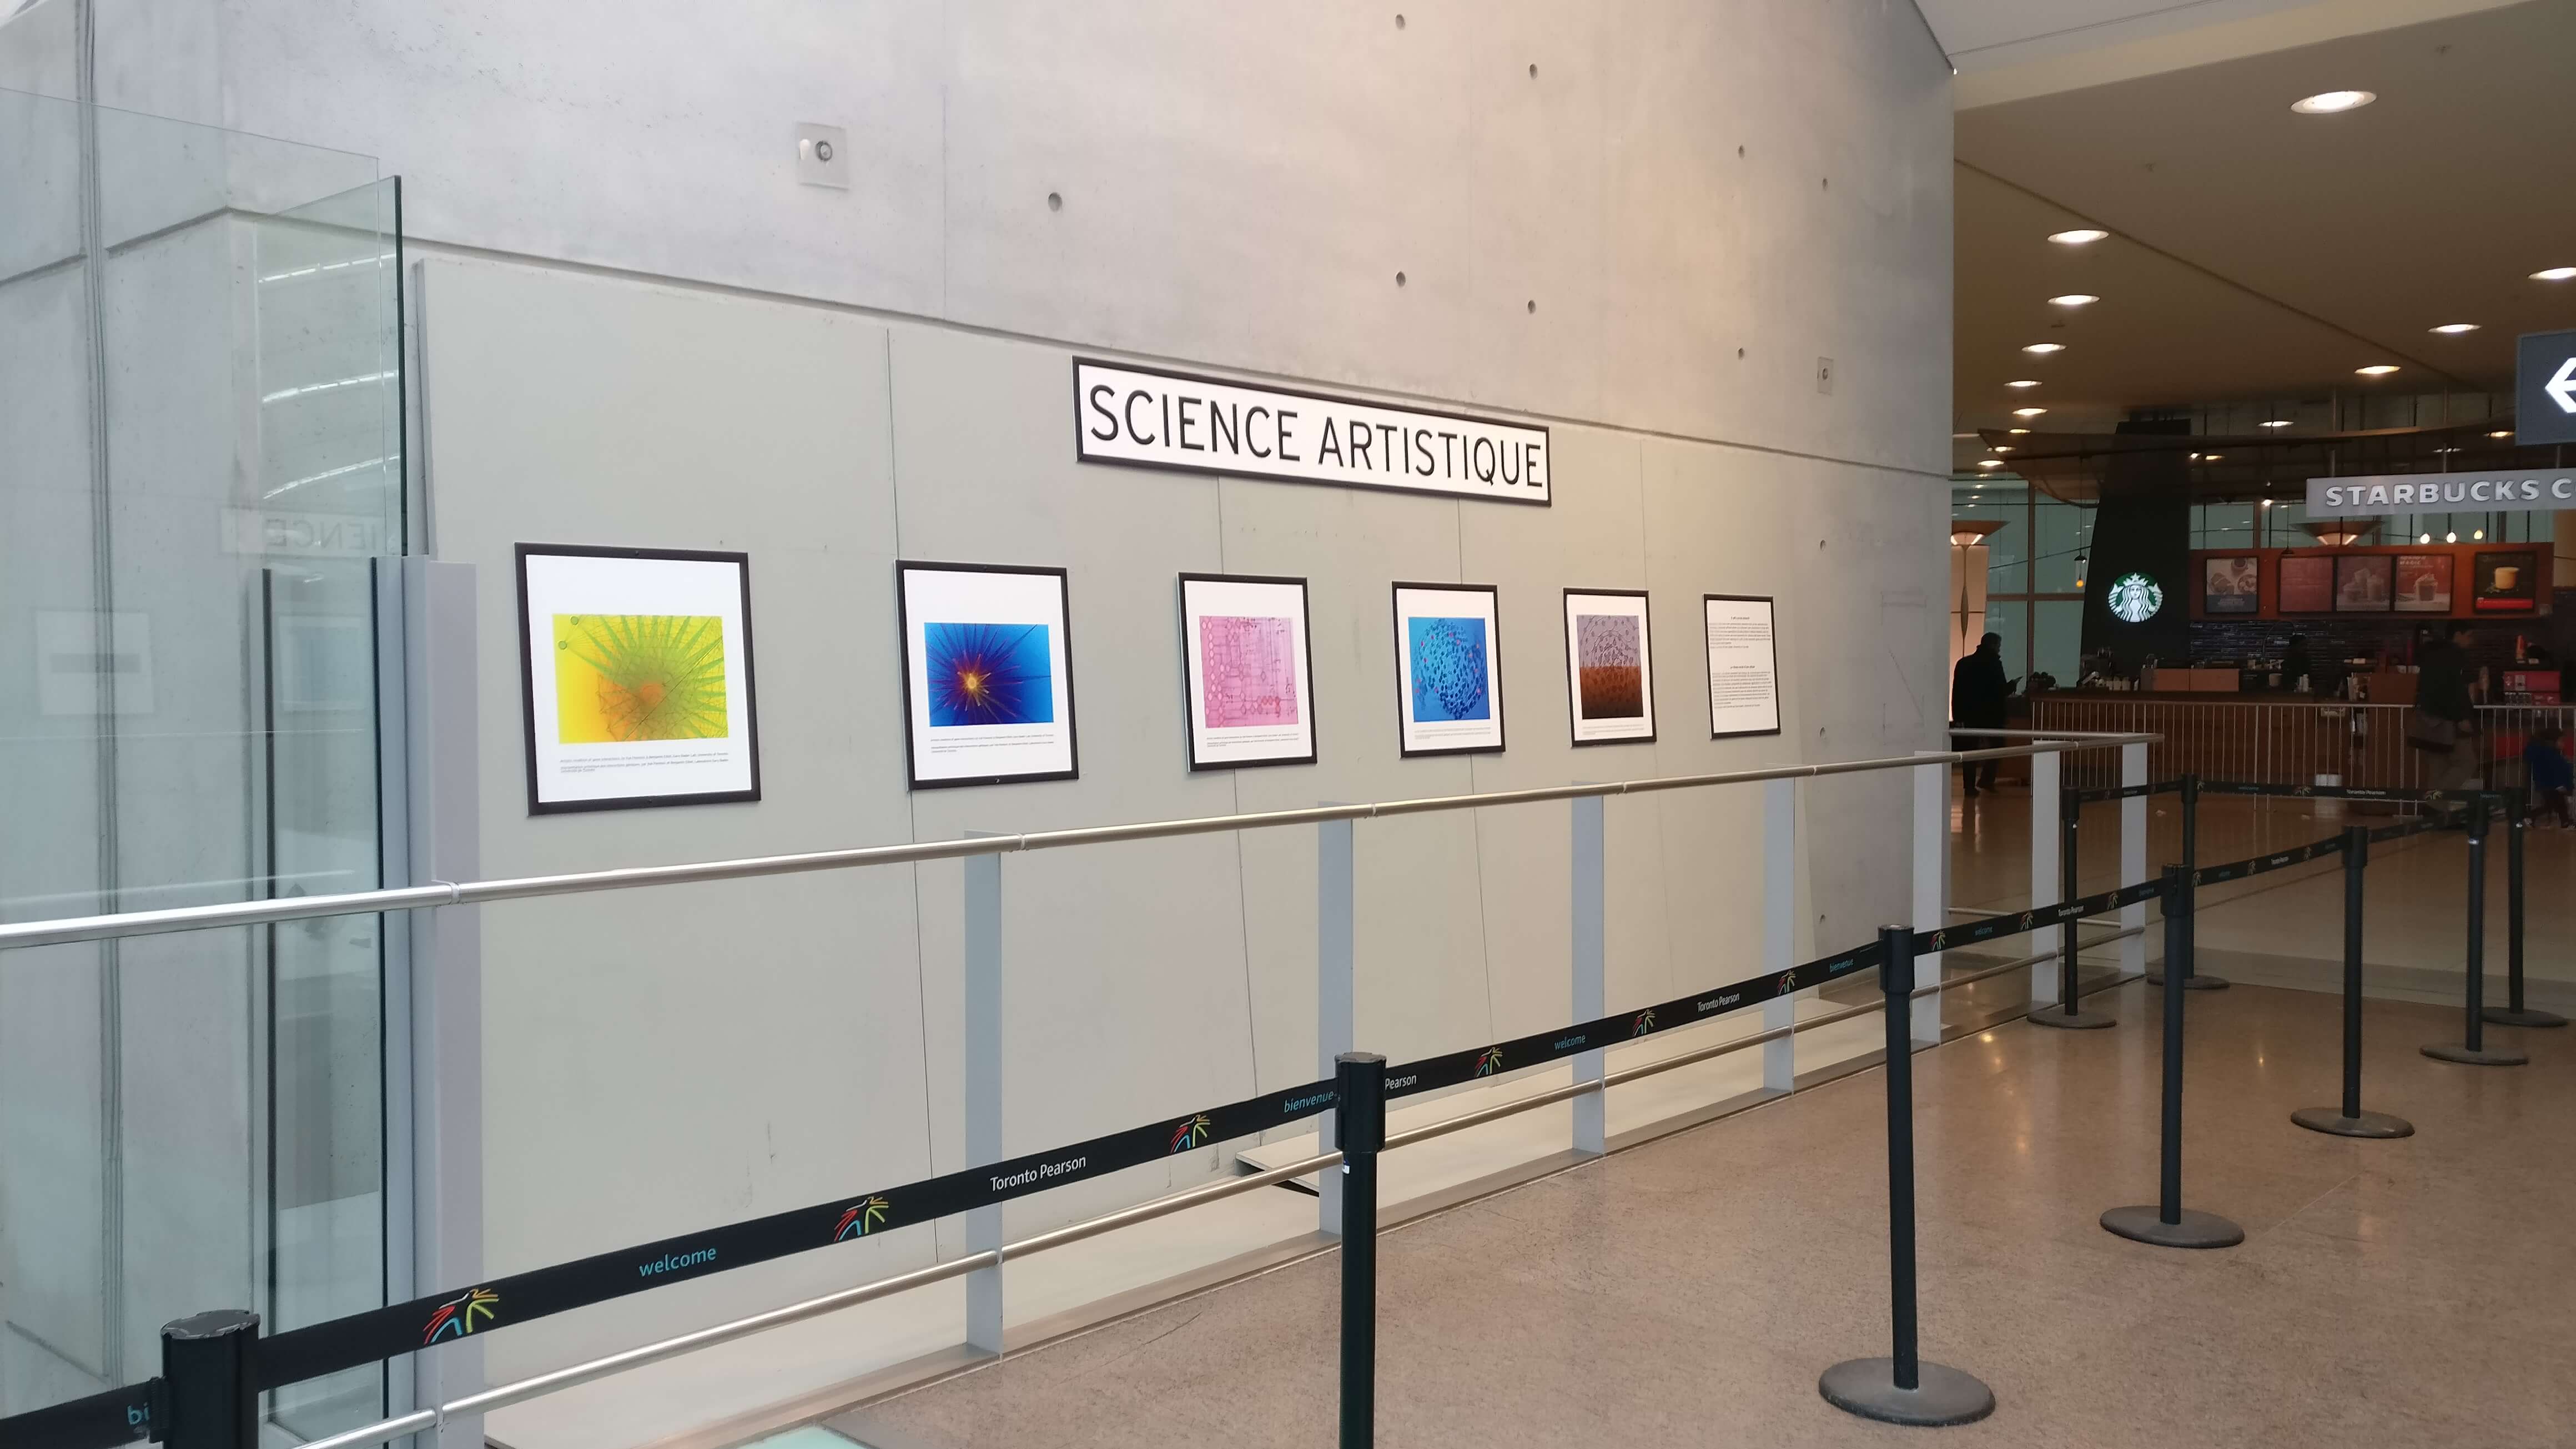
Bader came up with software that projects this data as a map that has revolutionized the field of yeast genetics (which is less niche than it may sound — yeast are an incredibly useful model for testing the interactions between proteins in a variety of controlled environments; for instance, you can see how they react if they are exposed to a particular drug). Artistic renditions of some of his maps are currently on display at the Toronto International Pearson Airport.
As another example, many researchers today are tackling the best way to assign identities and states to single cells in a population based on their differing gene expression patterns. Computer software is able to distinguish these cells on a variety of dimensions, which is very confusing for us (creatures that only think in one to three dimensions). With further limitations of graphs that are typically two-dimensional, these dimensions are often compressed or manipulated in a way that we can project the data in two dimensions and say, “okay, so these dots that are clustered together are similar cells, and these ones on the opposite corner are different from them.”

If we don’t continue to improve how we communicate these data — not only to others, but ourselves — we are putting a cap on research advances, as well as creating a bigger divide between the scientific community and the public. Since a guiding principle of science is to advance all of our knowledge, it is our responsibility as researchers to ensure that we bridge this gap, and close existing divides as effectively as possible.


